By default, widgets display the values of their metrics based on the most recent data. Some widgets have a feature that allows them to show the values at a specific time, which can be selected from a special input box shown in the widget.
Users can dynamically change the content of the widget selecting a date and time, and it will be recalculated on the bases of the chosen values.

Figure: Selection Date and time from the calendar box.
These Widget Types at the moment are the follows:
- WidgetBarSeries
- WidgetPieChart
- WidgetRadarSeries
- WidgetCurvedLineSeries
In widgetRadarSeries and widgetPieChart, the datetime input box is currently by default set as active and uneditable, while in widgetCurvedLinesSeries and in widgetBarSeries it is set as deactivated and can be activated in the more options menu in the editing mode of the dashboard.
Select "Yes" in the Show Calendar Button to activate the input datetime menu in the widget.

Figure: Active or Deactive Calendar Button in modify widget menu.
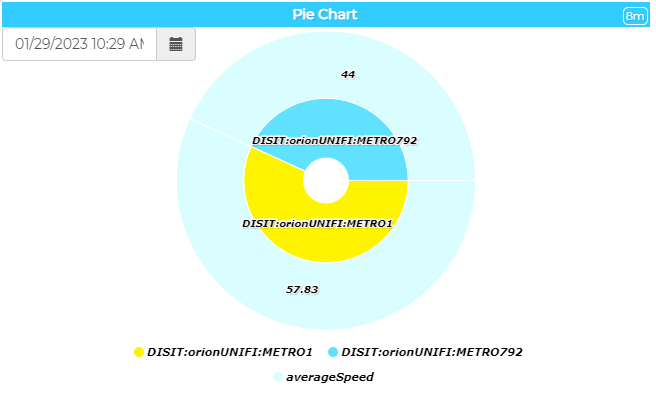
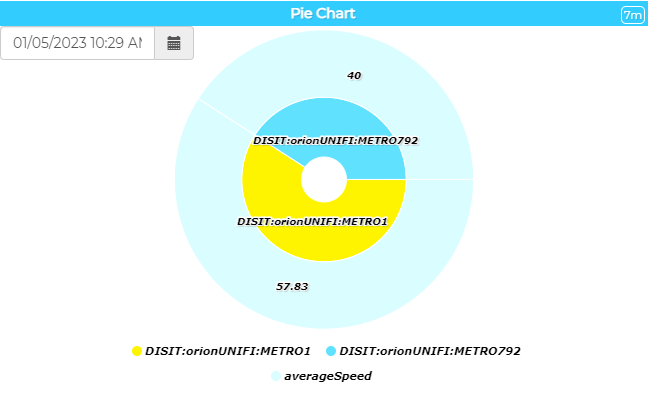
10.1 widgetPieChart
By default, the widgetPieChart shows the most recent data, but through the input of the datetime picker it is possible to view the metrics data at a specific date and time.
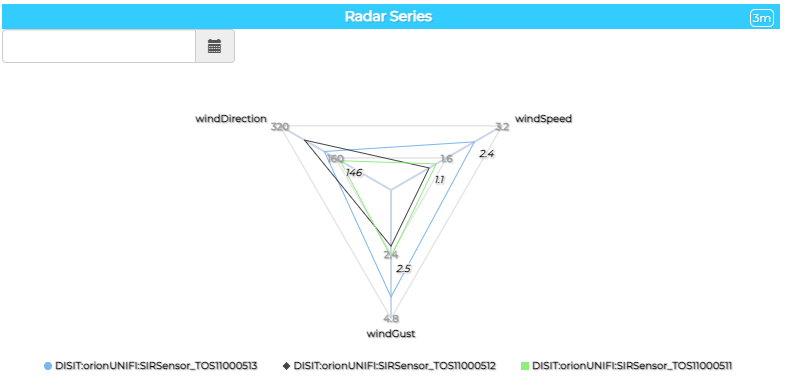
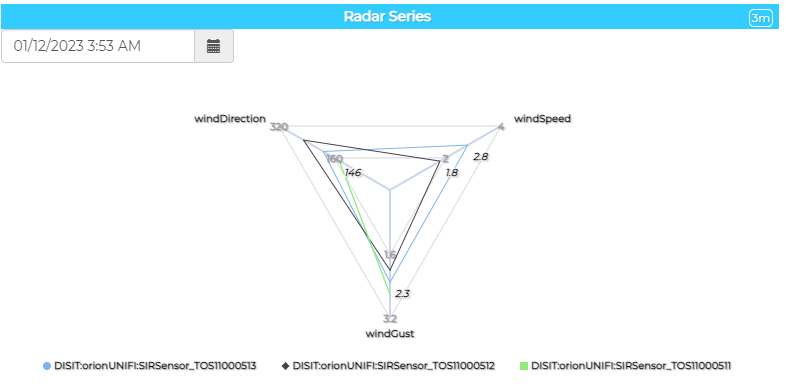
10.2 widgetRadarSeries
By default, the widgetRadarSeries shows the most recent data, but through the input of the datetime picker it is possible to view the metrics data at a specific date and time.
10.3 widgetBarSeries
By default, the widgetBarSeries shows the most recent data, but through the input of the datetime picker it is possible to view the metrics data at a specific date and time.
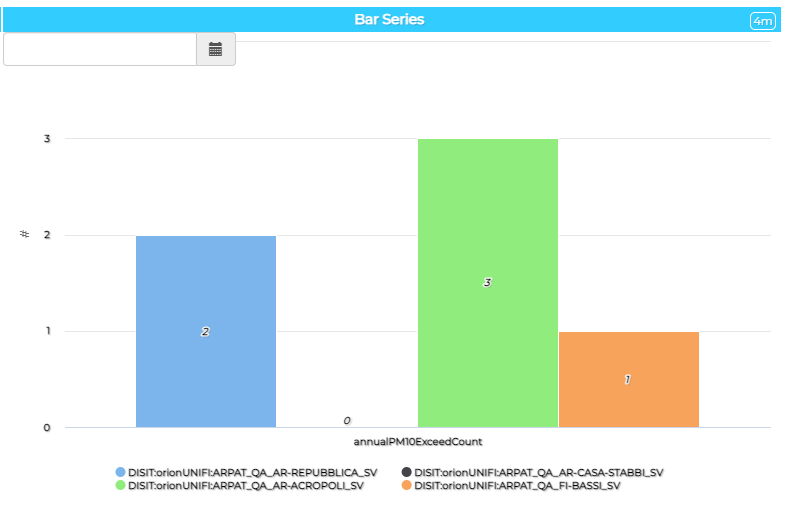
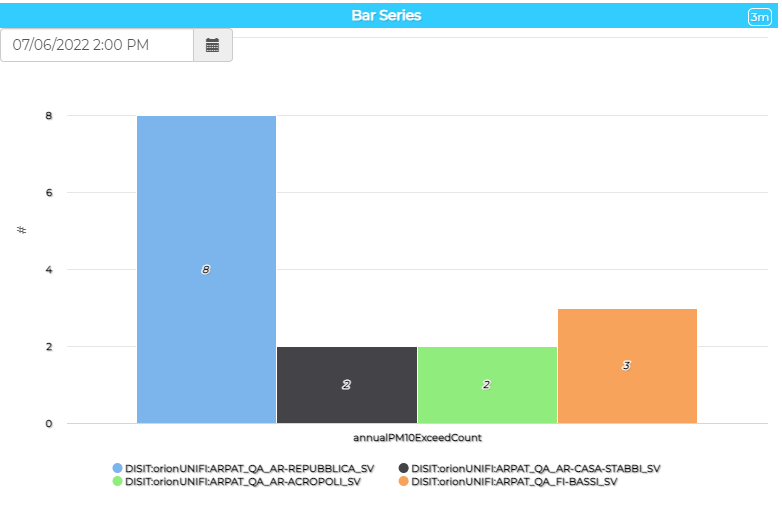
The functionality of activating and deactivating the datetime input can be done through the more options menu accessible in the editing mode of the dashboard, at the input selection Show Calendar Button.
10.4 widgetCurvedLines
The Curved Lines Series widget displays a timeline based on a time range, definable from the edit menu in editing mode, which has by default the date and time of the last metric detection as the graph's last point.
Through the calendar functionality it is possible to define the date and time of the graph's last point. The graph will be recalculated on the basis of the current time range.
For example, if the dashboard is displayed on May 1st 2023 at 10.00 and the time range set is one month, the graph will show the data from 04/01/2023 10:00 to 05/01/2023 10:00.
If we set the datetime picker to 1 February 2023 at 12:00, keeping the same time range, the graph will automatically be recalculated with the data from 01/01/2023 12:00 to 02/01/2023 12:00. It is also possible to change the time range while keeping the new set datetimepicker final point.


In editing, the functionality of activating and deactivating the datetime input can be done through the more options menu accessible in the editing mode of the dashboard, at the input selection Show Calendar Button.