This tutorial explains how to activate and download report in Snap4city and is indicated particularly for users with a profile as final user/manager.
This is the second part of a tutorial dedicated to the integration and management of the report Templates generation in Snap4City. In fact, this tutorial is divided in three parts as follow:
- How to create a Snap4City Report Model. This part is aimed at a developer user.
- How to activate and download a Report (this page).
- How to manage the Report generator (for administrator user)
2) How to activate and download a Report
In Snap4City it is possible to activate the production of periodic reports to be downloaded as PDF documents and reporting all useful information regarding the resource of interest.
NOTE: actually the report activation is allowed only for the RootAdmin user and is limited to devices.
The production of periodic reports can be activated with the following periodicity: every hour, every month, or quarterly.
In the Data Inspector interface the user can activate or deactivate the scheduling for the generation of a periodic report for a specific device and set the time interval. This command activates a REST API request in the JasperReport Server that activate the job scheduler and send to the server the corresponding parameter: the name of the device, the information regarding the name of the files to be created, the destination table (defined in a specific configuration file in Snap4city tool) and the metadata on the time interval of the scheduling, such as the start date for the creation of the files.
Please note that, monthly report are produced the first day of every month and quarterly report every three month. This means that if a monthly report is activated, the report will be produced the first day of the next month with the data of the previous month. In the case of a quarterly report, it are produced the first day of the following months: January, April, July, October and contains the data of the three months before.
To activate a report, in the main menu on the left column, select the Data, my Data, OpenData item and click on the Data Inspector subitem. The Data inspector tool is open in the main area.

In the Data sources table, in the first column High-Level type filter the list of data sources by selecting only the type identified as Sensor (1). Scroll the list of devices in the table and click on the Helthiness circle (2) of the device of interest.

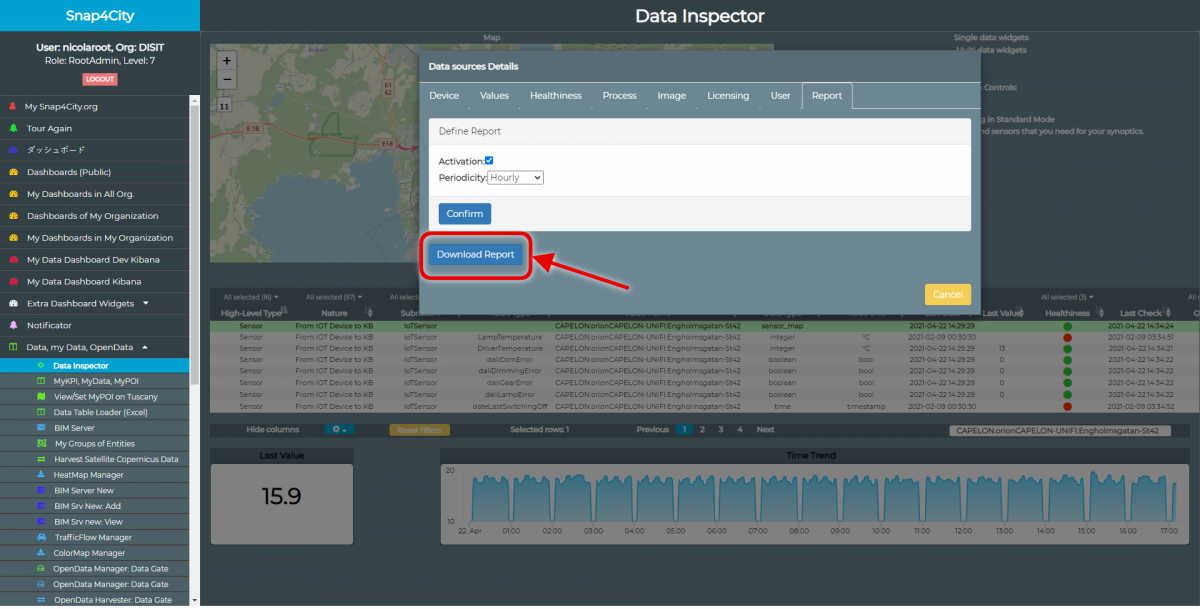
A popup is opened showing many details about the selected Data source. In the popup, select the Report tab (the last tab). The Report tab allows to activate/deactivate the report production and to define the periodicity of the Report publication that can be produced hourly, monthly or quarterly. Click the Confirm button to save.

Report Download
To download a report:
1. in the main menu on the left column, select the Data, my Data, OpenData item and click on the Data Inspector subitem. The Data inspector tool is open in the main area.

2. In the Data sources table, in the first column High-Level type filter the list of data sources by selecting only the type identified as Sensor (1). Scroll the list of devices in the table and click on the Helthiness circle (2) of the device of interest.

3. A popup is opened showing many details about the selected Data source. In the popup, select the Report tab (the last tab). If a report is available for the selected device, click on the Download Report button do download it. The last avalable report is downloaded.

An example of report can be download by clicking here.
