In Snap4City there are a number of simulations tools. https://www.snap4city.org/1053
In this page, the integration of SUMO simulator with Snap4City is presented.
On this regard, the integration is based on two main cases A and B as described in the following, firstly in draft and then detailed.
Case A: SUMO simulation with its preparation on premise and execution on Snap4City
- setting up a simulation using SUMO and its neteditor (defining your area of simulation, load, flows, etc.) on your local computer and
- loading the SUMO simulation data on Snap4City platform
- execute the SUMO simulation on Snap4City platform servers
- get the results by downloading results traces of SUMO as in terms of data and/or getting results as 3D visual representation via SUMO Web3D integrated in Snap4City.
- assess the results on your PC by using the downloaded traces from SUMO execution
Case A has the advantages to
- use cloud infrastructure resources for executing SUMO simulation on a server,
- run the simulation for longer time (the set up can be on small time window while the actual execution on server may be much longer),
- run multiple simulations in parallel according to infrastructure resources.
- Keep track of all the simulations via Simulations Manager which may be based on the same set up, and differ for duration, and start execution time
On some Snap4City installation some limitations on the usage of the resources are imposed according to the usage agreement signed.
Case B: SUMO simulation with its preparation and execution on Snap4City
- setting up the simulation using Snap4City Scenario Editor (https://www.snap4city.org/977 ) and exploit big data on snap4city platform.
- [the set up for simulation is converted in SUMO files directly and automatically by the Snap4City tools, and thus they are ready to be used on SUMO simulator on cloud]
- execute the SUMO simulation on Snap4City platform servers
- get the results by downloading results traces of SUMO as in terms of data and/or getting results as 3D visual representation via SUMO Web3D integrated in Snap4City.
- assess the results on your PC by using the downloaded traces from SUMO execution
Case B has the advantages to
- use Snap4City scenario editor which is faster and simpler to be used and it is web based, so that accessible for all. It also keeps trace of all variation and versioning you perform.
- refer to huge data storage and cases accessible on Snap4City infrastructure In the simulation setup and in the assessment.
- exploit data processing capabilities of Snap4City platform in Python, RStudio, Javascript for using any kind of math, ML, AI library and CPU/GPU including: predictions, anomaly detection, routing, multimodal routing, traffic flow reconstruction, ODM generation, heatmaps, etc.
- use cloud infrastructure resources for executing SUMO simulation on a server,
- run the simulation for longer time (the set up can be on small time window while the actual execution on server may be much longer),
- run multiple simulations in parallel according to infrastructure resources.
- Keep track of all the simulations via Simulations Manager which may be based on the same set up, and differ for duration, and start execution time
Case A: SUMO simulation with its preparation on premise and execution on Snap4City

(a) Setting up a simulation using SUMO and its neteditor (defining your area of simulation, load, flows, etc.) on your local computer. Offline-Generated SUMO Files (.sumocfg, .net.xml, .rou.xml, etc.). The .net.xml file must be generated using netconvert with the parameter --offset disable-normalization="true" as specified in the documentation (https://sumo.dlr.de/docs/netconvert.html). This process will allow you to actually control the view during the SUMO Web3D representaton and real time simulation as decribed on the right side of the figure.
(b) loading the SUMO simulation data on Snap4City platform. The user can load (Sumo File Loader of Snap4City) an existing SUMO simulation with all the required files (.sumocfg, .net.xml, .rou.xml, etc. compatible with SUMO 1.15). During the loading process, a name can be assigned to the simulation, and a duration can be set. The duration can be manually specified; however, if a different duration is defined in the .sumocfg file, the simulation follows that value. (please note that the SUMO File Loader of Snap4City and the Simulations Manager are typically hosted on the same Dashboard/view tool of Snap4City). Depsite the duration imposed on .sumocfg or in loading the duration can be imposed also during the real time simulation on Sumo Web 3D as described in the following steps.
In Version 2 of the loader and Snap4City integration with SUMO, the SUMO loader is asking Date and Time of the simulation start from which the simulation should start.
This information and the information regarding the virtual devices declared in file *.sumocfg as
<additional-files value="zonizzazione.add.xml,polygons.xml,vtype_definition.xml,sensors.add.xml"/>
in file sensors.add.xml (please use this file name) is used to put virtual sensors as induction loops and to generate the data for real time traffic flow:
<?xml version="1.0" encoding="UTF-8"?>
<additional xmlns:xsi="http://www.w3.org/2001/XMLSchema-instance" xsi:noNamespaceSchemaLocation="http://sumo.dlr.de/xsd/additional_file.xsd">
<!-- Detectors -->
<inductionLoop id="zone1_e1_0" lane="1337582000#0_0" pos="91.01" period="300.00" file="post_processing.xml"/>
<inductionLoop id="zone1_e1_1" lane="1337582001#2_0" pos="103.29" period="300.00" file="post_processing.xml"/>
<inductionLoop id="zone1_e1_10" lane="318933773#3_0" pos="25.03" period="300.00" file="post_processing.xml"/>
<inductionLoop id="zone1_e1_11" lane="318933773#3_1" pos="24.58" period="300.00" file="post_processing.xml"/>
.....
The traffic flow data can be produced off line in file post_processing.xml that will contain all data with the imposed time period. That will be in the FOLDER of the simulation date and time and of the form
<detector xmlns:xsi="http://www.w3.org/2001/XMLSchema-instance" xsi:noNamespaceSchemaLocation="http://sumo.dlr.de/xsd/det_e1_file.xsd">
<interval begin="25200.00" end="25500.00" id="zone1_e1_0" nVehContrib="24" flow="288.00" occupancy="2.82" speed="12.83" harmonicMeanSpeed="12.77" length="4.50" nVehEntered="24"/>
<interval begin="25200.00" end="25500.00" id="zone1_e1_1" nVehContrib="32" flow="384.00" occupancy="4.41" speed="11.35" harmonicMeanSpeed="10.89" length="4.50" nVehEntered="32"/>
<interval begin="25200.00" end="25500.00" id="zone1_e1_10" nVehContrib="3" flow="36.00" occupancy="0.35" speed="12.79" harmonicMeanSpeed="12.77" length="4.50" nVehEntered="3"/>
<interval begin="25200.00" end="25500.00" id="zone1_e1_11" nVehContrib="0" flow="0.00" occupancy="0.00" speed="-1.00" harmonicMeanSpeed="-1.00" length="-1.00" nVehEntered="0"/>
<interval begin="25200.00" end="25500.00" id="zone1_e1_12" nVehContrib="16" flow="192.00" occupancy="1.89" speed="12.79" harmonicMeanSpeed="12.71" length="4.50" nVehEntered="16"/>
.............
In alternative/addition, the simulation can produce traffic flow data in real time, during the simulation with the rate imposed by the "period". The sensors data are directly produced in Traffic Flow Sensors of Snap4City models. And thus are directly accessibble as sensors and to perform traffic flow reconstruction.

https://www.snap4city.org/dashboardSmartCity/view/Gea-Night.php?iddasboard=NDUxMg== accessible only for authorized users and on specific Snap4City platforms.
(c) execute the SUMO simulation on Snap4City platform servers. After loading, the user can run the simulation (Simulations Manager of Snap4City). Via the Simulations Manager the simulation status can be: “TO BE STARTED,” “RUNNING,” or “COMPLETED.” Upon completion, when the simulation status is “COMPLETED,” the tripinfo file from SUMO.
(c1) In alternative the execution of a loaded SUMO simulation can be performed on a Snap4City dashboard view tools (as on the right side of the figure) in which the SUMO Web3D is integrated. The Simulation in this case can be started and stopped, and it is represented on a 3D space on left at run time. In this mode, the duration is managed by the user, who can stop the simulation manually. Additionally, it is possible to view the number of agents in the simulation in real time and visualize roads and intersections by their IDs. During execution or after all the simulations can be monitored as status through the dashboard (Simulation Monitor of Snap4City). Each Simulation is saved in independent data space with its duration and starting time and produce related tripinfo file which can be downloaded by the user.
https://www.snap4city.org/dashboardSmartCity/img/dashScr/dashboard4344/lastDashboardScr.png accessible only for authorized users and on specific Snap4City platforms.
(d) get the results by download traces of SUMO as in terms of data and/or getting results produced by simulation and representation via SUMO Web3D integrated in Snap4City.
(e) for the assessment of results, the generated results can be downloaded for KPI assessment on PC. In alternative some Python process can be implemented or used those already implemented and accessible on Snap4City for estimating key performance indicators KPI such as mean travel time, waiting counts, etc.
Case B: SUMO simulation with its preparation and execution on Snap4City

(a) Setting up a simulation using Snap4City Scenario editor (https://www.snap4city.org/977 ) and exploit:
- big data (historical and real time) on snap4city platform infrastructure from the scenario definition.
- data processing capabilities of Snap4City platform in Python, RStudio, Javascript for using any kind of math, ML, AI library and CPU/GPU including: predictions, anomaly detection, routing, multimodal routing, traffic flow reconstruction, ODM generation, heatmaps, etc.
(b) The Snap4City Simulation set up based on Scenario need to be converted in SUMO files. To this end, the Snap4City Scenario has to be converted in an ACC version “ACCORPATO/ACCORPATED” version. The ACC version is a JSON file which is converted in SUMO files producing .net and .rou files. The generated files (.sumocfg, .rou, .net) can be downloaded, and the simulation can be visualized. For passing tis phase (b) two microservices are accessible and ca be used from CSBL of a Snap4City dashboard as well as from the IoT App / proc.Logic. They are the so-called ACC and Snap4City converters. The transformation of a Scenario from INIT status to ACC version can be performed by using and accessible tool as: https://www.snap4city.org/1078 or directly by the Snap4City to SUMO format Converter.
https://www.snap4city.org/dashboardSmartCity/img/dashScr/dashboard4344/lastDashboardScr.png accessible only for authorized users and on specific Snap4City platforms.
(c) execute the SUMO simulation on Snap4City platform servers. After loading, the user can run the simulation (Simulations Manager of Snap4City). Via the Simulations Manager the simulation status can be: “TO BE STARTED,” “RUNNING,” or “COMPLETED.” Upon completion, when the simulation status is “COMPLETED,” the tripinfo file from SUMO.
https://www.snap4city.org/dashboardSmartCity/img/dashScr/dashboard4344/lastDashboardScr.png accessible only for authorized users and on specific Snap4City platforms.
(c1) In alternative the execution of a loaded SUMO simulation can be performed on a Snap4City dashboard view tools (as on the right side of the figure) in which the SUMO Web3D is integrated. The Simulation in this case can be started and stopped, and it is represented on a 3D space on left at run time. In this mode, the duration is managed by the user, who can stop the simulation manually. Additionally, it is possible to view the number of agents in the simulation in real time and visualize roads and intersections by their IDs. During execution or after all the simulations can be monitored as status through the dashboard (Simulation Monitor of Snap4City). Each Simulation is saved in independent data space with its duration and starting time and produce related tripinfo file which can be downloaded by the user.
(d) get the results by download traces of SUMO as in terms of data and/or getting results produced by simulation and representation via SUMO Web3D integrated in Snap4City.
(e) for the assessment of results, the generated results can be downloaded for KPI assessment on PC. In alternative some Python process can be implemented or used those already implemented and accessible on Snap4City for estimating key performance indicators KPI such as mean travel time, waiting counts, etc.
KPI Computing
This section describes the simulation key performance indicators (KPI) available in Snap4City and information on the log file generated for each simulation runm which can be downloaded from the user as one of the results. The computation of KPI comuting is performed by calling a MicroService developed in Python from a Dashboard/vew CSBL or from an IoT App/Proc.Logic.
File Traffic Info
At each simulation run, a traffic info file is generated containing detailed information on each vehicle that participated in the simulation. The "Get TRIP INFO FILE" button allows to download the file containing simulation details. For each vehicle, the following information is recorded:
Detail of Information
|
Campo |
Tipo |
Descrizione |
|
id |
(vehicle) id |
Name of the vehicle described by this entry. |
|
depart |
(simulation) s |
Real time of departure (time when the vehicle enters the network). |
|
departLane |
(lane) id |
ID of the lane from which the vehicle started its trip. |
|
departPos |
m |
Position in the lane from which the vehicle started its trip. |
|
departSpeed |
m/s |
Speed at which the vehicle started its trip. |
|
departDelay |
(simulation) s |
Waiting time before the vehicle started its trip. |
|
arrival |
(simulation) s |
Time in which the vehicle reached the destination. |
|
arrivalLane |
(lane) id |
ID of the lane the vehicle was in at the time of arrival. |
|
arrivalPos |
m |
Position in the lane the vehicle was in at the time of arrival. |
|
arrivalSpeed |
m/s |
Speed of the vehicle on arrival. |
|
duration |
(simulation) s |
Time taken by the vehicle to complete the route. |
|
routeLength |
m |
Length of vehicle route. |
|
waitingTime |
s |
Time during which the vehicle speed was less than or equal to 0.1 m/s (scheduled stops do not count). |
|
waitingCount |
# |
Number of episodes in which the vehicle speed was less than or equal to 0.1 m/s. |
|
rerouteNo |
# |
Number of times the vehicle was recalculated. |
|
vtype |
ID |
Vehicle type. |
|
speedFactor |
float |
Individual vehicle speed factor (possibly derived from an initial distribution). |
|
vaporized |
bool |
Indicates whether the vehicle was removed from the simulation before reaching the destination. |
Simulation KPIs
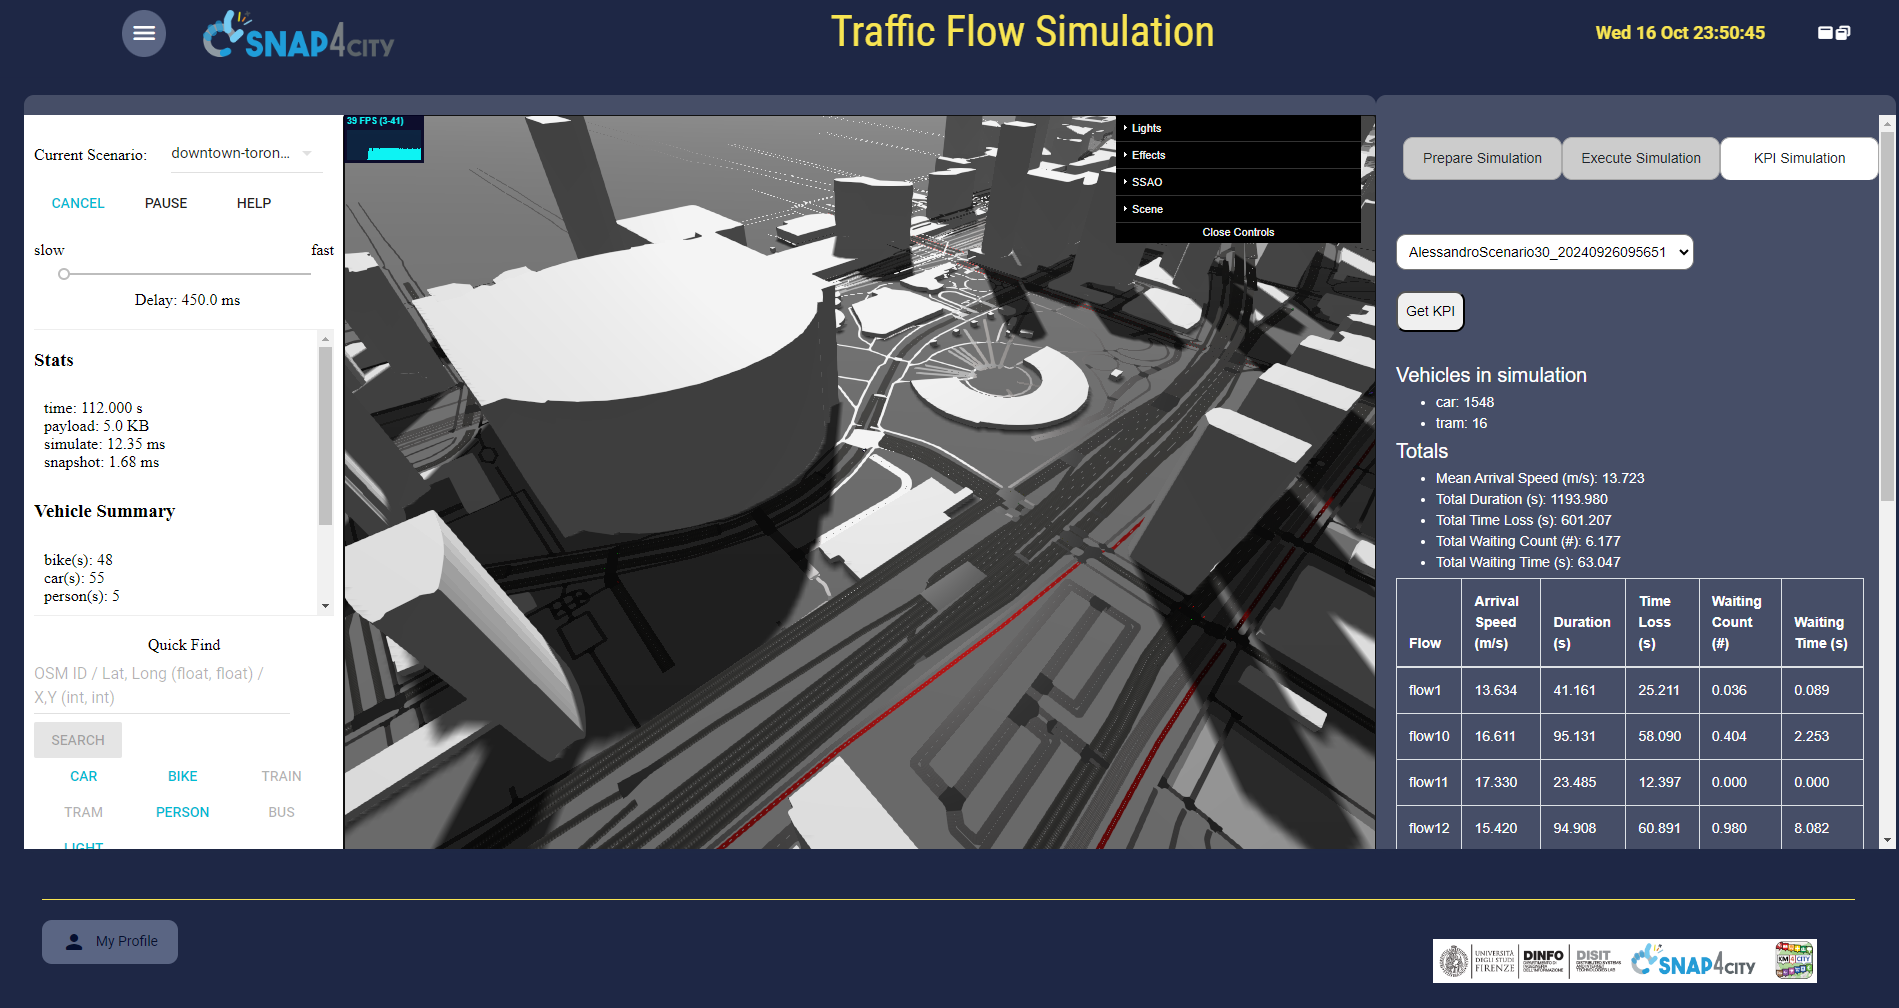
The KPI SIMULATION tab on the above referred dashboard/view of Snap4City simulation view displays the overall KPIs of the simulation. You can view the KPI by clicking on Get KPI. Key metrics include:
Global KPI
|
Description |
|
|
Mean Arrival Speed (m/s) |
Average speed at the time of arrival of all vehicles in the simulation. |
|
Total Duration (s) |
Total simulation duration. |
|
Total Time Loss (s) |
Overall time lost due to driving at a lower than ideal speed. |
|
Total Waiting Count (#) |
Total number of waiting episodes of all vehicles. |
|
Total Waiting Time (s) |
Total time spent by vehicles with a speed of 0.1 m/s or less. |
KPI for traffic directions
In a dedicated table, the KPIs for each traffic direction in the scenario can be analysed. The data include:
|
Direction |
Arrival Speed (m/s) |
Duration (s) |
Time Loss (s) |
Waiting Count (#) |
Waiting Time (s) |
|
Direction 1 |
... |
... |
... |
... |
... |
|
Direction 2 |
... |
... |
... |
... |
... |
This data makes possible to compare the performance of the various directions and to identify any criticalities in the simulated network.