The design and development of the smart application Graphic User Interface, GUI, means to develop views which put in connection the back-office data with some visual representation and provide to the user interactive elements to change the observed view or go for another.
In Snap4City, the views are implemented as Dashboards which are composed by graphical widgets connecting storage on the basis of the Entity Instances, Processing Logic (IoT App) data/nodes in stream, Synoptics, External Services, and Brokers [Dashboards2019]. Widgets can be maps, time trends, chords, spidernet, barseries, tables, buttons, animated elements, sliders, etc., from libraries as D3 and Highcharts or custom Synoptics widgets by using an SVG-based integrated tool and templates. Moreover, the Dashboard may dress different styles / themes in their rendering and the designer / developer can select them soon or later in the creation process.
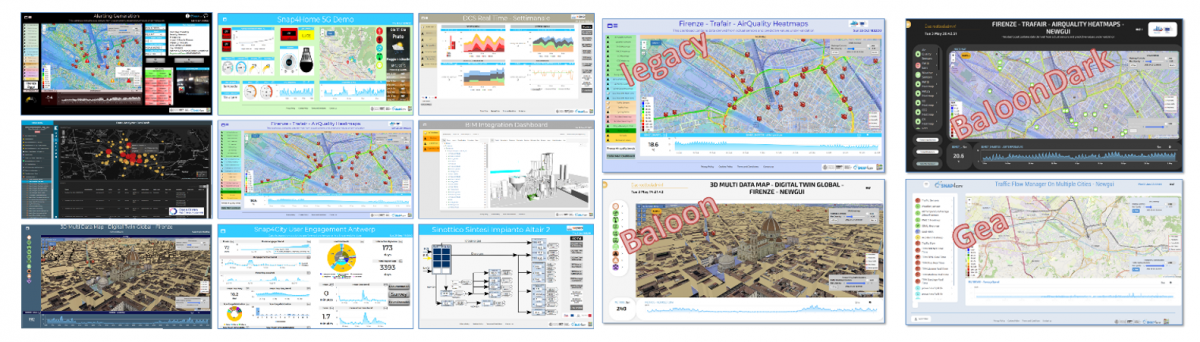
Figure: Several Kinds of Dashboards, examples of themes.
The powerful of the user interface is grounded on the possibility of easily connecting the graphic widgets with the Entity Instances, and with the possibility of gluing them in smart interactive manner, keeping human in the loop (see Figure 19c). For example: selecting an area or clicking on a Pin/service on map and connecting related data to widgets with a pie and to the time series, or producing some computation such as the average values, the max or other, etc. To this end, the User Interface needs to provide some business logic which can be on server-side (formalized in Processing Logic/IoT App, Node-RED) to serve all the users at the same time, and client-side for evolving user interface behavior on each client device autonomously. Client devices are typically a browser but could be also a mobile app.
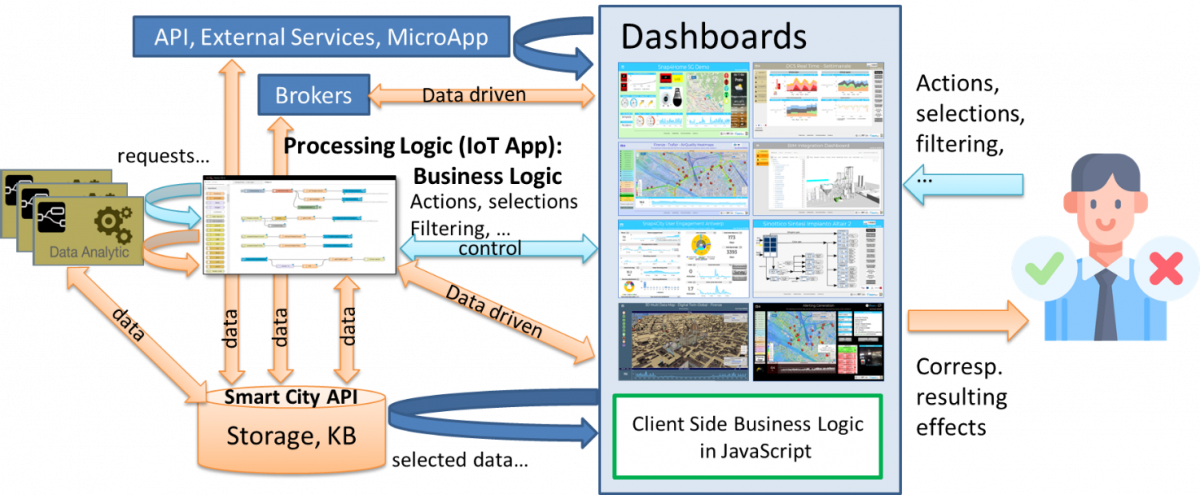
Figure: Relationships among storage, Processing Logic (IoT App), and Dashboards
with server-side and client-side business logics.
According to SMADE-lc, the design of views starts with the production of Dashboards’ mockups. For each Dashboard a set of suggested information is requested such as: aim, status, target device, GUI style, list of widgets and their description, and the business logic kind.
The Dashboards are called passive when the data represented come only from storage without any event driven connection from platform to dashboard and vice versa, for business logic or for just presenting/producing data in real time. Active views/dashboards are those that provide those connections. They are initially developed as passive Dashboards in first sprints and get smarter and smarter in successive sprints of the life cycle. Moreover, for fast prototyping the server-side business logic is developed by using IoT App Node-RED, which provides a set of nodes corresponding to connect graphical widgets on dashboards (via secure WebSocket) [MicroServices2019] (thus, overcoming the limitation of native dashboards of Node-RED). This approach is very effective and viable for fast prototyping and to realize strictly synchronized smart applications in which all the actions on web interface are shared with all the users (typically limited) as happen in IoT world. For example, the monitoring panel of an industrial plant should present the same data to all the users connected to it.
On the other hand, when the users expect to play with the data for some business intelligence, their experience and the evolving data represented in the interface according to their activities is going to change. Those aspects are personal, and context based as one expect to have on a smart application, leading to an evolving user interface that should have a client-side business logic. In Snap4City, the development of client-side business logic can be implemented by adding JavaScript functions attached to the graphic widgets call back actions, which can perform actions on other widget and on the platform, such as a REST Call to API. Note also that, typically IoT dashboards are implemented as single web page, however it is also possible to link multiple dashboards so to have different interfaces that the user can navigate. For example, a main dashboard could list some devices, then by clicking on one of such devices a new dashboard is open showing details on the specific device. This can be achieved exploiting the client-side business logic by using specific JavaScript function calls able to both open a new dashboard and possibly send some data.
According to SMADE-lc, IoT App for data ingestion, transformation, etc., and those for business logic could be developed by different developers. On one hand, those functionalities could be located on different flows of the same IoT App, even if it is not suggested. On the other hand, when event-driven applications are developed, the integration of flows for data streams processing and that of business logic may be almost mandatory. A way to allocate those flows in different IoT Apps could be to pass events from two IoT Apps passing messages via one of the platform brokers (NGSI Orion Broker in Snap4City).
To develop this phase one has to follow the Dashboard descriptions performed in the design phase. And at the same time has to answer at questions such as:
- Does the user interface have to provide some dynamic changes on the basis of the user actions? Which kind of changes?
- How many users are using it?
- Is it a view for control room and decision makers or a business intelligence tool for playing with data and solutions?
- Etc.
How to proceed: The developers on Snap4City can visually create dashboards with a drug and drop approach by using Dashboard Builder which is assisted by a number of tools shortly described in the sequel.
The main concepts are based on the fact that Dashboards:
- can be complex web pages for providing information and rendering and ALSO for getting data and interaction from the users.
- are built for composition of a set of Widgets.
- can communicate with Server-Side Business Logic.
- can host internally server-side business logic.
- embed any other frame.
- can be connected each other.
The Snap4City Dashboard system is used in several cities and projects and can be accessed from:
- SEE several examples of dashboards from Technical overview.
- Scenarios: https://www.snap4city.org/4
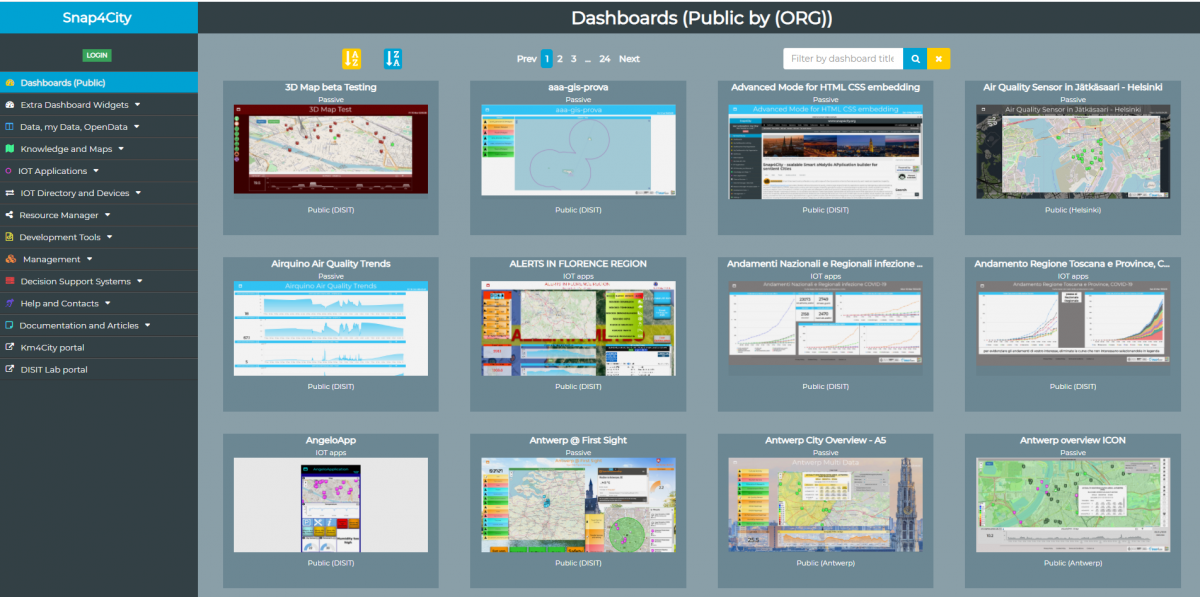
- A large List of Public Dashboards on Snap4City.org (many others are in other installations of Snap4City, and most of them are not public): https://www.snap4city.org/dashboardSmartCity/management/dashboards.php.
Snap4City Dashboard system is capable to:
- show dashboards on the web browser in an H24/7 modality;
- show data on widgets according to several graphic paradigms (tables, graphs, histograms, maps, Kiviat charts (spider net), lists, tv camera, heatmaps, weather, critical city events, 3D, D3.JS, etc.) with a level of interactivity and animation;
- use the Arabic language and Hijri date format and conversions;
- show data on autonomous and connected/ synchronized widgets;
- collect, show, and keep data updated on the screen with an automated refresh for each view, and real-time data according to the even-driven paradigm;
- show data both real-time and historical, allowing the drill down on time, space and relationships among data and city entities;
- provide a solution to have dashboards connected with IoT App and platform by using end-2-end secure connections based on Web Socker secure, TLS, HTTPS;
- collect and show data coming from different big data and classic data sources (SQL, NoSQL, RDF, P2P, API, SOLR, Elastic Search, etc.) also in aggregated manner;
- allow to customize Widgets as Synoptics and also exploiting graphic libraries;
- work with a large amount of data providing high performances, such as short response time;
- compute alarms, and provide support by a flexible notification system capable to send alerts, activating tickets for maintenance, automating actuators, post on social, etc.;
- provide actuators widgets together with showing graphs, and capable to act on IoT Devices;
- provide support for collaborative production of dashboards and co-working;
- provide support for embedding dashboards into third-party web pages;
- provide data engine for collecting connection response time on different protocols, and for verifying the consistency of web pages via HTTPS;
- allow cloning dashboards;
- allow giving access to the dashboards to other users;
- integrating with Proc.Logic / IoT Apps by managing real-time data and connecting its actuators to real-time IoT Apps, thus having in Proc.Logic / IoT App the Server-Side Business logic of one or more dashboards;
- integrate dashboards in more complex dashboard systems;
- script business logic of the Dashboard into the dashboard in JavaScript (Client-Side Business Logic) and/or into Proc.Logic / IoT App;
- Control Video Wall configuration from the Dashboard and/or IoT App Business logic;
- support authentication and authorization with the most general approaches such as LDAP, and SSO;
- collect and get data from batch resources and in real-time, using a large range of protocols and formats;
- Associate them a dashboard specific menus;
- Connect to each dashboard a dedicated chat room for discussing problems and events.
- Etc.
Dashboards may be single or connected. They are typically not a single view, but a view of a set. From the main Dashboard you may need to jump to other views/Dashboards. See the following example of the Smart City Control Room, SCCR, of Florence Metropolitan City (since 2017) which has more than 1.5 million inhabitants, and >14 million Tourists per year, plus students and commuters. The figure shows the main dashboards used by the Florence Mayor (Dario Nardella) and the second-level dashboards. The third and fourth levels are present as well. https://www.snap4city.org/525
Control room with control video wall: https://www.snap4city.org/621
Florence Control Room: https://www.snap4city.org/531

Dashboards may show data coming from Big Data stores, IoT Apps and other sources/databases. They are produced in real-time and may show real-time event-driven data for the decision-makers, officials, city users, totem, operators, fire brigade, emergency, civil protection, police, operators, leaders, etc., according to a controlled and secure connection on HTTPS, secure WebSocket and GDPR compliant environment. They allow representing and managing critical events, receiving notifications, drilling down on data, opening live chats for problem-solving, acting in correspondence of alarms by an intelligent monitoring, defining workflows, performing simulation, and What-IF analysis.
For what-if analysis see: https://www.snap4city.org/download/video/course/da/

In Snap4City, there is a specific tutorial for the Dashboard development with several examples: https://www.snap4city.org/download/video/course/das/.