3 - CSBL Visual Editor modality
The Snap4City CSBL Visual Editor is a graphical interface which is integrated in the Snap4City Dashboard Builder to make easier to implement business intelligence dashboards and thus smart applications. CSBL Visual Editor has been designed to reduce the coding for producing high valuable results and it is accessible for non-programming skilled users. On t the other hand it also enables fully skilled JavaScript programmers to exploit more functionalities, by scripting, and may be passing at the Full Custom CSBL to exploit full potentialities of snap4City Dashboard Builder.
The CSBL Visual Editor can be opened in the dashboard page (from the edit mode), by clicking on the “CSBL Editor” button in the upper menu bar. A detail of the graphic interface of the CSBL Editor is displayed in Figure 4. In the CSBL Visual Editor, each node of the flow chart represents a widget of the dashboard (identified by its unique ID displayed in the “WidgetName” box). In these nodes/widgets the user can write the JavaScript code (in the “Code” box) that implements the desired CSBL for each event related to the specific widget (shown in the “Event” box), so that each event and action of the current widget can trigger the execution of a specific JavaScript code (check Section 2.1 for a list of the available events). Therefore, changing the event selection in the “Event” changes also the visualization of the specific code associated to that event, which is displayed in the “Code” box.
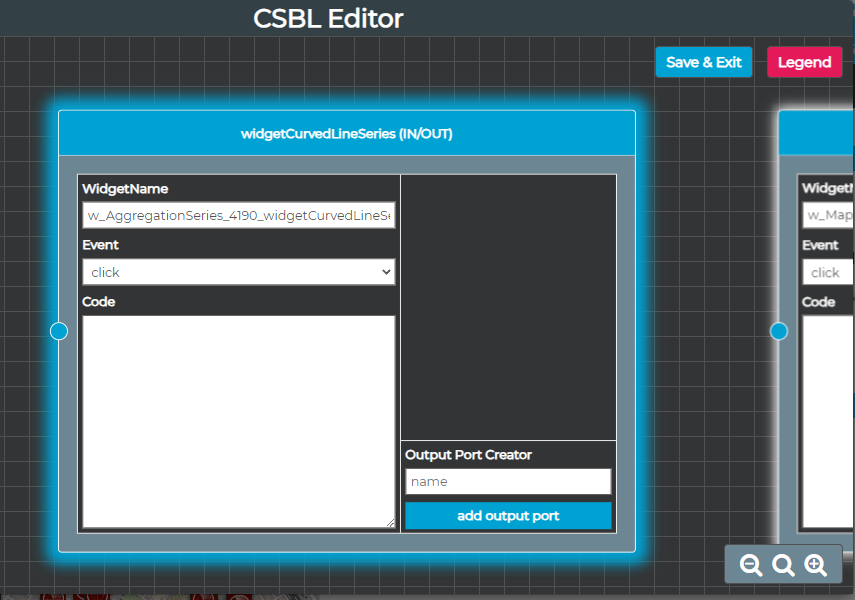
Figure: The CSBL Visual Editor Graphical User Interface: single widget view
At the present version of this document, the CSBL Editor is working for the following widgets (implementing their IN, OUT and IN/OUT functionalities as described in the tables in Section 1.1): widgetBarSeries, widgetCurvedLineSeries, widgetMap, widgetPieChart, widgetRadarSeries, widgetGaugeChart, widgetSpeedometer, widgetSingleContent. Regarding the other widgets not included in the previous list, the CSBL Editor may allow to view and edit the JavaScript code (as explained in the following), but it may be not still fully compliant to handle IN and OUT connections. Further adaptations and developments of the CSBL Editor will be made to improve compliance with all the other widgets will be evaluated and implemented in future deployments.
3.1. Widget Events
In the following table, all the available events are listed and all the widgets supporting each event at the current state of the CSBL Visual Editor. In future developments, all the widgets (according to tables in Sections 1.2/1.3) will be leveraged. User events are those coming from the GUI of the widget acted by the users, while CMD are those that may arrive from other widgets from the Input port of the widget. See Table in Section 1.2.
|
Events |
Supported Widget Types |
Description |
User/ Cmd |
Output Type |
|
click |
widgetBarSeries |
Click on a single bar / kiviat |
user |
SURI |
|
legend_item_click |
widgetBarSeries, |
Click on legend item |
user |
ListSURI |
|
geo_drill_down |
widgetMap
|
Geographic drill down considering all the devices and entities displayed on the current bounding box of the widgetMap |
user |
ListSURI |
|
time_zoom |
widgetCurvedLineSeries
|
Temporal zoom on multi-series widgets |
User |
DateTime |
|
reset_zoom |
widgetCurvedLineSeries
|
Reset temporal zoom on multi-series widgets |
User |
DateTime |
|
external_commands (compatibility event with Full Custom CSBL, read in the following)
|
widgetBarSeries |
Event for implementing custom JavaScript code (in this case, it is recommended to check the code compliance with the CSBL Editor template as described in Section 3) |
Cmd |
custom |
Currently, the “external_commands” event is a special event aimed at handling Full Custom CSBL segments (included directly into the CKEditor from More Options) which are not compliant with the CSBL Visual Editor template
3.2. IN/OUT Connections
Each Widget in the CSBL Visual Editor presents a single input port, to which one or multiple output ports from other widgets can be connected. In those widgets that involves also output functionalities (i.e., sending messages to other widgets), an additional section is shown in the right part of the node, which is dedicated to specifying the output ports, as depicted in the next Figure.
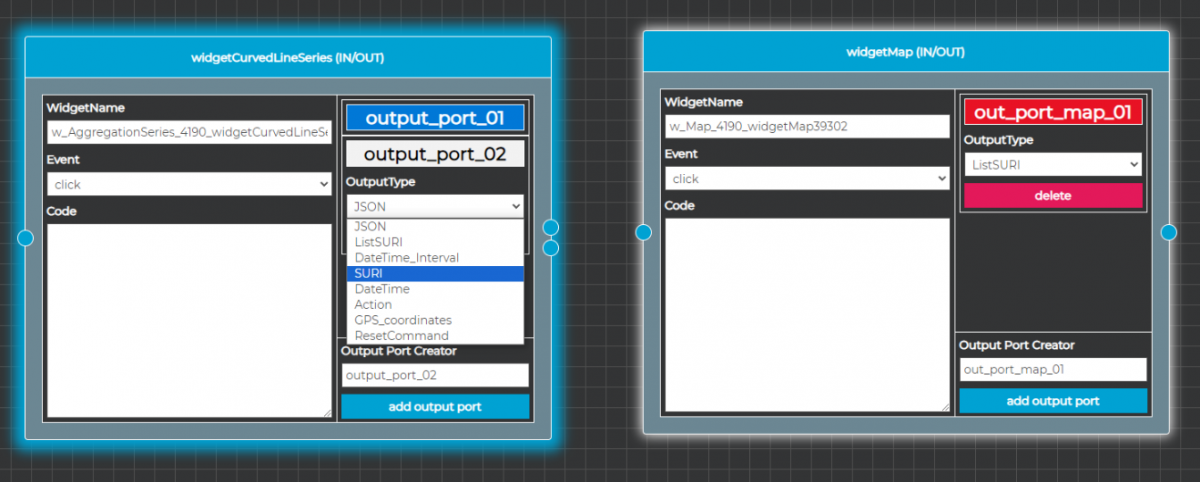
Figure: Adding output ports to a Widget/node into the visual editor.
At the bottom of the widget representation into the CSBL Visual Editor, the user can add a new output port by writing a desired output port name and by clicking the “add output port” button. The names of the output ports must be unique in the Widget. After adding an output port, it is possible to access further information by clicking the button with its name. Actually, each output port has to be classified to be of a specific data type (OutputType) which is produced from that port. Moreover, a delete button is provided to remove the selected port from the design (see the right node/widget in Figure 5).
The OutputTypes are coherent with the possible Inputs that can be received by the IN and IN/OUT Widgets as described in Section 1.3.
The Full Custom CSBL has less/no restrictions on this kind of message types.
The different OutputTypes for the messages exchanged among widgets available are listed in the following (see the left node in Figure 5):
- SURI: Snap4City Service URI. This OutputType is suitable in those cases in which it is needed to send data related to a single Service URI. For instance, when clicking on a single graphical element of a widget related to a single IoT Device (a single bar, a single pie chart sector etc.).
- ListSURI: array of multiple Snap4City Service URI. This OutputType may be suitable in those cases in which it is needed to send data related to multiple Service URI at once (for instance, clicking on the legend of a widget when the user wants to hide from view data related to some devices, while sending data related to all the other devices which are not excluded from current visualization.
- DateTime: a timestamp in Unix epoch milliseconds format. This may be suitable to send single timestamp, for instance when clicking on a single chart point in a time-trend or multi-series widget.
- DateTimeInterval: a temporal interval identified by lower (t1) and upper (t2) limits, represented in Unix epoch milliseconds format. This may be suitable when selecting a temporal interval to zoom in a time-trend or multi-series widget.
- GPSCoordinates: geographic coordinates (Latitude, Longitude) which are typically sent when clicking on a free area on a map widget.
- JSON: generic JSON format which can be useful when the user needs to send generic data which can be handled by Full Custom CSBL.
- Action: They are actions performed by the user (such as the click of a button, the drag of the knob, etc. See table in Section 1.2) or from Input port of the Widget (typically avoided to prevent loops). They can be complex JSON.
- ResetCommand: rest is typically the return at the initial status, for example in the time default time range or condition of the widget (to be implemented in future developments). For example, the reset to conditions before drill down in time, see table in Section 1.2.
Each output port can be connected to the desired target widget(s), as depicted in Figure 6, by click/drag and drop a connections with the mouse, starting by clicking on the desired output circular pin related to the corresponding output port of the specific node (which have the same color and positional order from top to bottom, as shown in Figure 6) and dragging the connection line to the desired target widget input port (which has the same light blue color for all the nodes). Changing the type of output port will also reset the connections related to that port. Moreover, the position of each widget box can be arranged as the user wants in the CSBL Visual Editor panel. When ready, the user can click on the “Save & Exit” button to save the current CSBL Visual Editor configuration and return to the dashboard edit page visualization. The results would be a general configuration to all widgets of the dashboard, business intelligence view. Please remind that a set of views/dashboards can be connected / activated each other as well.
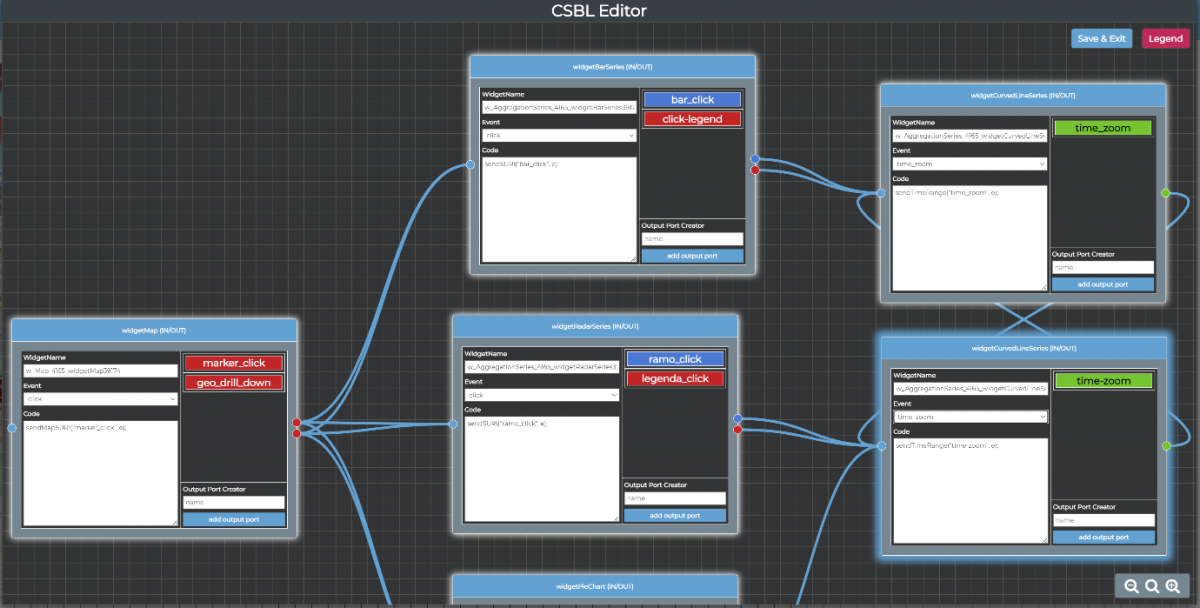
Figure: Widgets connections in the CSBL Visual Editor of a Dashboard.
The “Legend” button shows a short info box with different colors of Output ports and the main shortcuts and actions that can be performed in the CSBL Visual Editor (see next Figure).
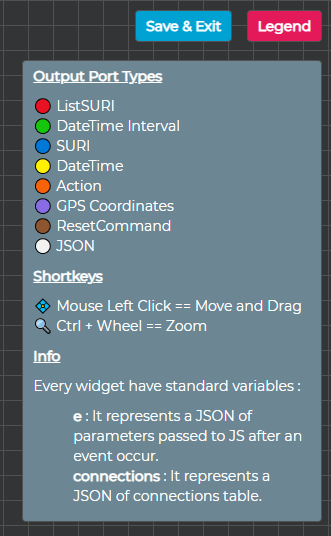
Figure: CSBL Editor Legend
3.3 Compatibility from Full Custom and CSBL Visual editor
However, in order to make the CKEditor code compliant with the CSBL Visual Editor (so that you can use both modalities, i.e. CKEditor and CSBL Visual Editor GUI to view and edit your CSBL), a default template has been added to the CKEditor Code which helps the user to understand how to write CSBL code in a way which is compliant with the CSBL Editor (see Section 4).
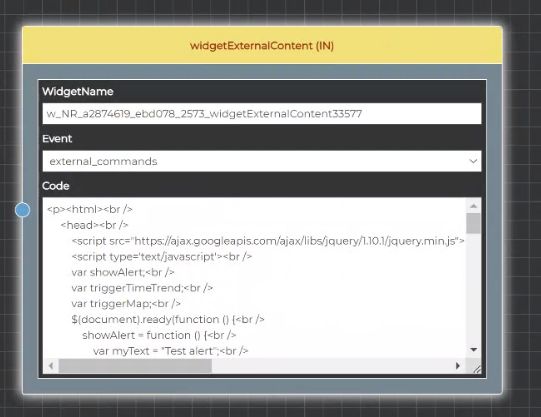
In case the CKEditor of a certain widget code is not compliant with the CSBL Visual Editor template of JavaScript, a yellow header is displayed for that widget, as well as warning message advising the user that continuing to edit and save the current code may lead to unexpected working or saving problems (see next Figure):
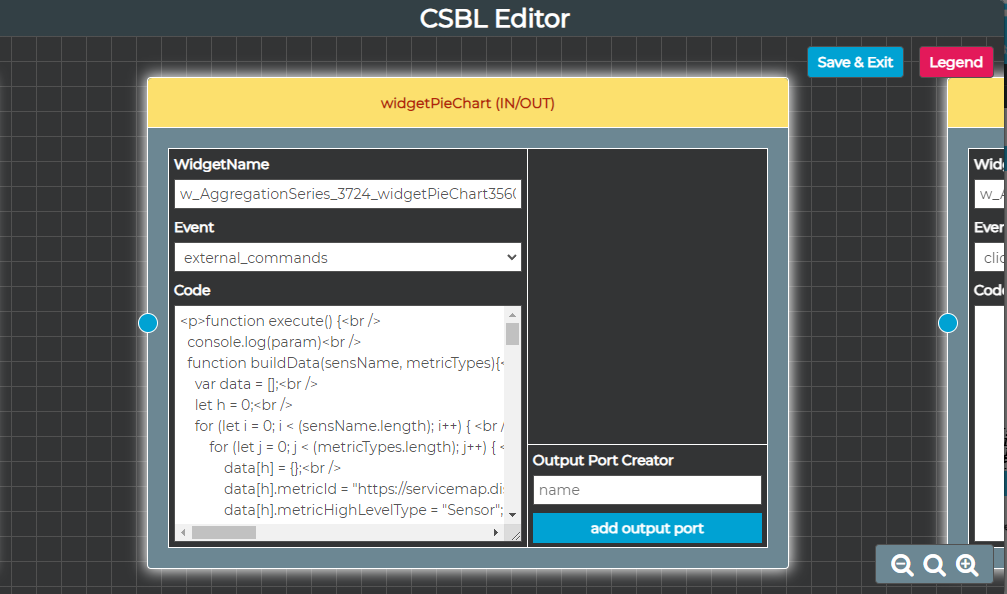
Figure 8 – Yellow header of a widget node warning that CKEditor code is currently not compliant with CSBL Editor template reported in the following.
The widget external content in the following figure has to be addressed as a full custom CSBL editor widget and thus the JavaScript is not structured according to CSBL Visual Editor template. This is the reason since it is typically market in Yellow. Please note that it is in effect and IN/OUT Widget without the output ports, providing maximum flexibility.
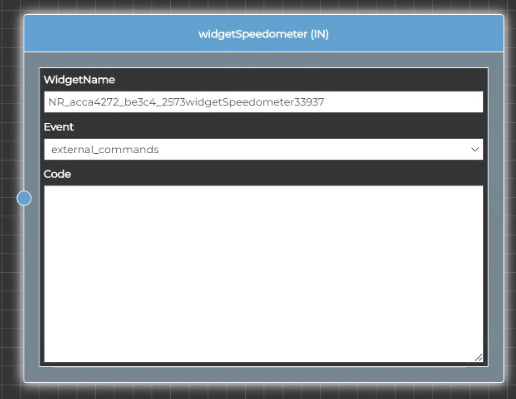
In the following figure an IN Widget, no output is present. In effect it is not present on Table of Section 1.2.
3.4. Example of Usage
In the public Snap4City dashboard “CSBL Editor Test” depicted in the next Figure, the CSBL Editor has been exploited to easily create a number of connections and interactions among the different widgets. The dashboard is available at the following URL: https://www.snap4city.org/dashboardSmartCity/view/index.php?iddasboard=NDE2NQ== in view mode; the edit mode is accessible to the dashboard owner only.
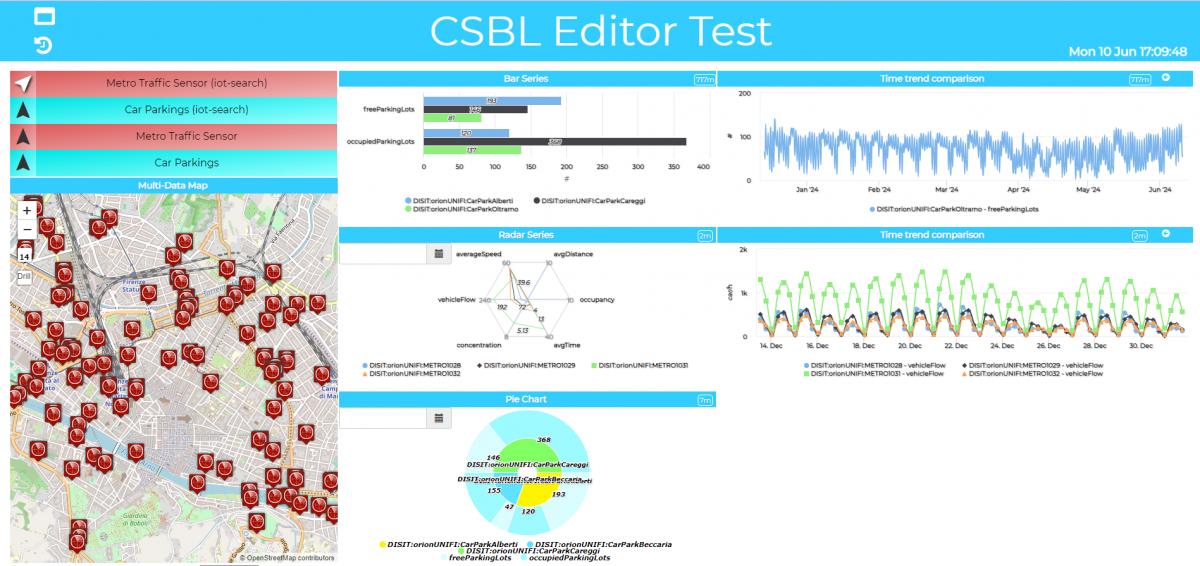
Figure 9 – CSBL Editor Test dashboard.
In the widgetMap on the left, it is possible to click on a single device marker, as well on the “Drill” button on the left for geographic drill-down, in order to send single SURI or an array of SURI, respectively. These data are sent to the three widgets on the centre, i.e.: a bar-series widget, a pie-chart widget and a radar widget, which can show the last values of passed data according to the different modalities. In the CSBL Editor, this is obtained in a very easy way as shown in the next Figure.
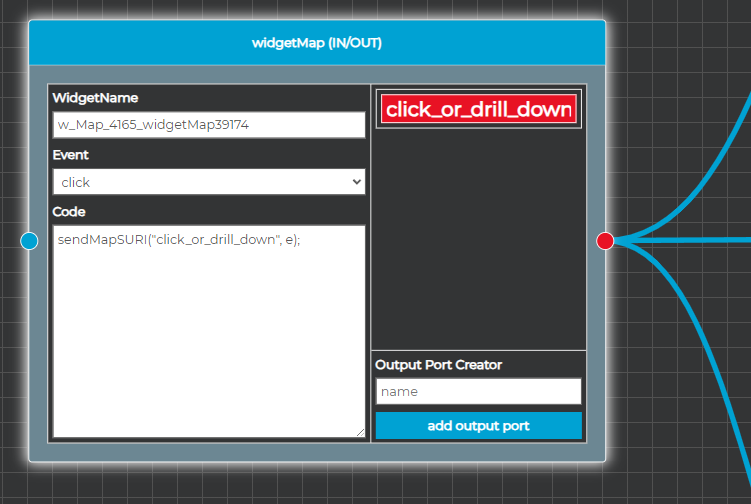
Figure 10 – Detail of the CSBL Editor related to the widgetMap node
In the widgetMap, the pre-defined sendMapSURI (“click_or_drill_down”, e) function (described in the table of Section 3.3, which can handle both SURI and List of SURI data sending modalities for the widgetMap) is called (that is, is written in the Code box) for both “click” and “geo_drill_down” events. In both cases, the widget data are automatically passed in the correct format in the pre-defined JavaScript e variable to the unique “click_or_drill_down” output port (actually, a single output port can handle all data of the same OutputType (as described in Section 3.2), even if related to multiple events. The three connections coming out from this node go to the bar-series, pie-chart and radar widgets, respectively (see figure below "General overview of the CSBL Editor flowchart for the dashboard described in this Section" for a general overview of the CSBL Editor flowchart).
Then, let’s consider the widgetBarSeries. In this case, the corresponding node in the CSBL Editor has been configured to: (i) send data to the multi-series on its right when clicking on a single bar (thus, related to a single Service URI) and to (ii) send data to the multi-series on its right when clicking on a legend item (thus, related to multiple SURI, i.e. the ones that are not excluded from visualization after clicking on the legend item). This can be done very easily in the CSBL Visual Editor by: (i) calling the pre-defined sendSURI("bar_click", e); function associated to the “click” event, which sends data passed in the pre-defined e variable to the “bar_click” output port (which is set to SURI as OutputType) and (ii) calling the pre-defined sendListSURIAndMetrcis("click-legend", e) function associated to the “legend_item_click” event, which sends data passed in the pre-defined e variable to the “click-legend” output port (which is set to SURI as OutputType), as depicted in Figure 11.
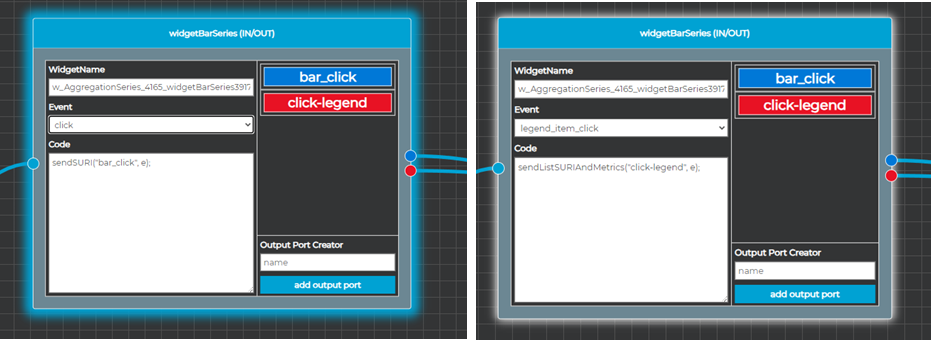
Figure: Detail of the CSBL Editor of the widgetBarSeries node related to the click event (i) and the legend_item_click event (ii)
Then, the multi-series widget which is target of the previous mentioned bar-series can send to itself time interval related to the time_zoom and reset_zoom events. This can be easily done in the CSBL Editor by calling the pre-defined sendTimeRange("time_zoom", e) function to the “time_zoom” output port for both time_zoom and reset_zoom events (as shown in the next Figure).
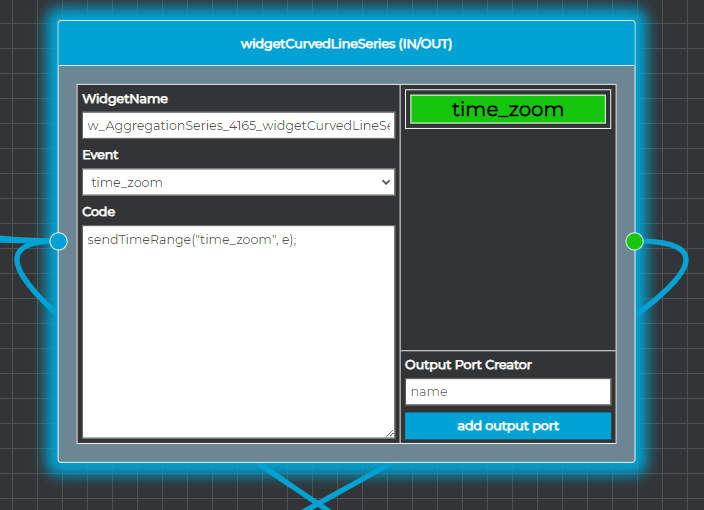
Figure: Detail of the CSBL Editor related to the widgetMap node
Finally, a general overview of the whole CSBL Editor flowchart is provided in the next Figure:
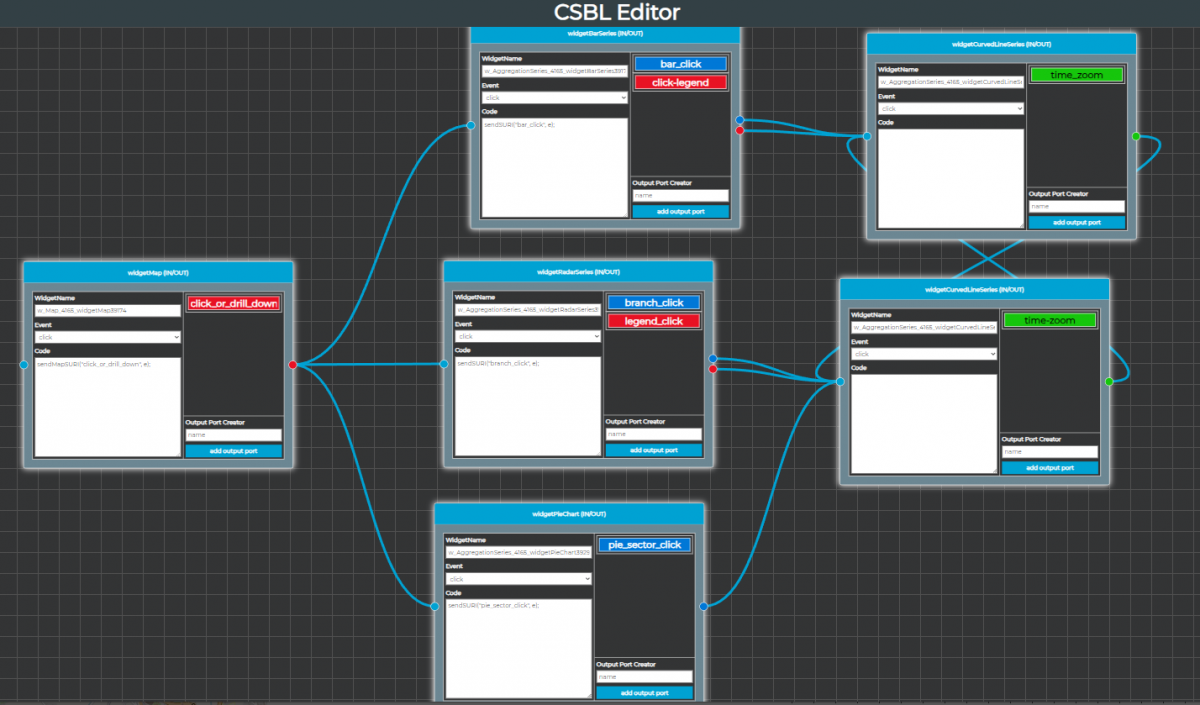
Figure: General overview of the CSBL Editor flowchart for the dashboard described in this Section