In the context of AMMIRARE, the Interreg Marittime action of the European Commission (https://interreg-marittimo.eu/it/web/ammirare), a dashboard is used to manage georeferenced vector fields describing natural effects like waves, winds, etc. It is used to perform three main operations:
-
Visualize inserted vector fields, possibly with their associated heatmaps, so to observe and study the natural phenomena
-
Insert new vector fields and possibly create the associated heatmap
-
Update the vector fields by providing new measurements to obtain a temporal evolution of the phenomenon
The dashboard is composed of two main parts:
-
On the left side, a control panel is available. From this panel it is possible to
-
load a previously inserted vector field
-
inset new vector field
-
-
On the bottom, an area for output messages is included
-
On the right side, the MultiDataMap widget is included and used to show the vector fields
Load a vector field
Using the top-right panel is it possible to load previously inserted vector fields. The panel searches for devices having the AmmirareVectorFieldModel entity model and lists them in the Vector Field Name dropdown menu. Once a vector field entity is selected, the system searches for its versions (identified by the timestamp) and lists the results in the Version dropdown menu.
The user selects a Vector Filed Name and a Version, then by clicking on Show vector field button, the system proceeds to load the data and display the vector field over the map.
Differently, clicking on the Reload list button, a new search for vector field entity is performed, updating the dropdown menu.
Note: depending on the size of the vector field, response time can change. Please be patient when loading huge amounts of data (e.g., over millions of points) are used.
Whether during the insertion of the vector field, the relative heatmap encoding the vector magnitudes has been created, it is also presented to the user when loading the data.
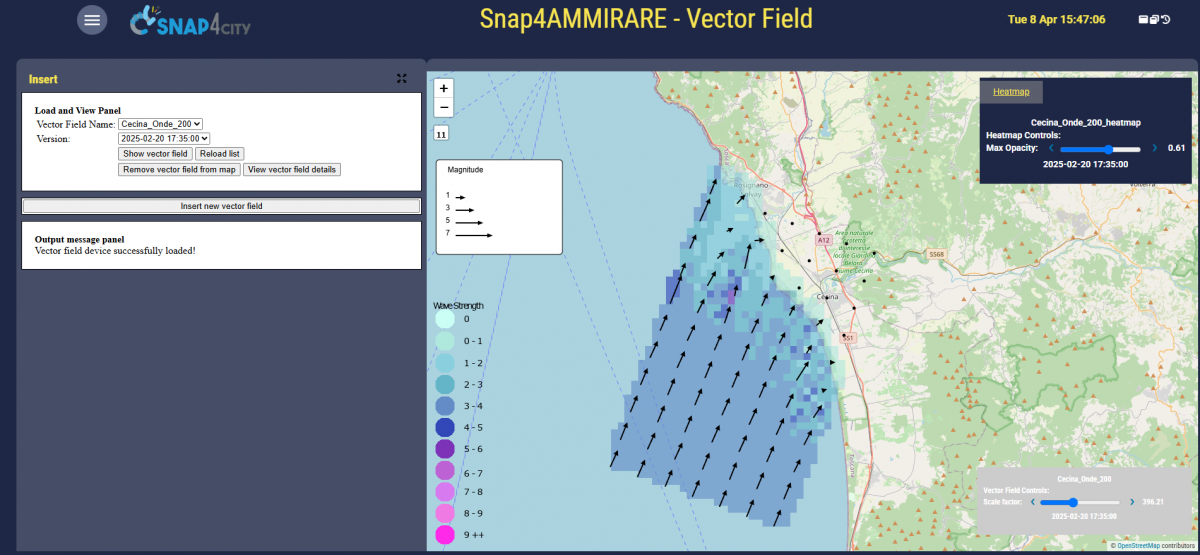
In the map, the vector field is visualized as a series of vectors aligned with a rectangular grid oriented according to an angle w.r.t. the North direction. According to the map zoom level, a different number of vectors are displayed: by increasing the zoom, more vectors appear. Each vector is oriented according to the angle and with a length proportional to its magnitude. Using the slider in in bottom-right panel, is it possible to scale the vector length for better visualization. When multiple versions of the vector field are available, they can be navigated using Next/Prev button in the panel.
By moving the mouse over the base-point of the vectors, a popup reporting the angle and magnitude of the vector is shown. A legend of the magnitude of the vectors is shown in the left part of the map. Vector dimensions in the legend are dynamically updated according to the scale factor selected.
Under the vector field a heatmap is shown (if it has been created during the vector field insertion). Heatmap values are encoded according to the heatmap colormap shown in the bottom-left corner of the map. Using the slider in the Heatmap panel in the top-right corner of the map it is possible to change the heatmap opacity. Note that, version navigation is controlled only from the vector field panel. Corresponding heatmaps are loaded automatically.
After loading the data, in the loading panel additional buttons appear:
- Remove vector field from map: by clicking the loaded vector field (and heatmap) is removed from the map
- View vector field details: show the details of the vector field opening a new panel under the loading panel. From such panel it is possible to insert new data and then update the vector field creating a new version.
Update vector field creating a new version
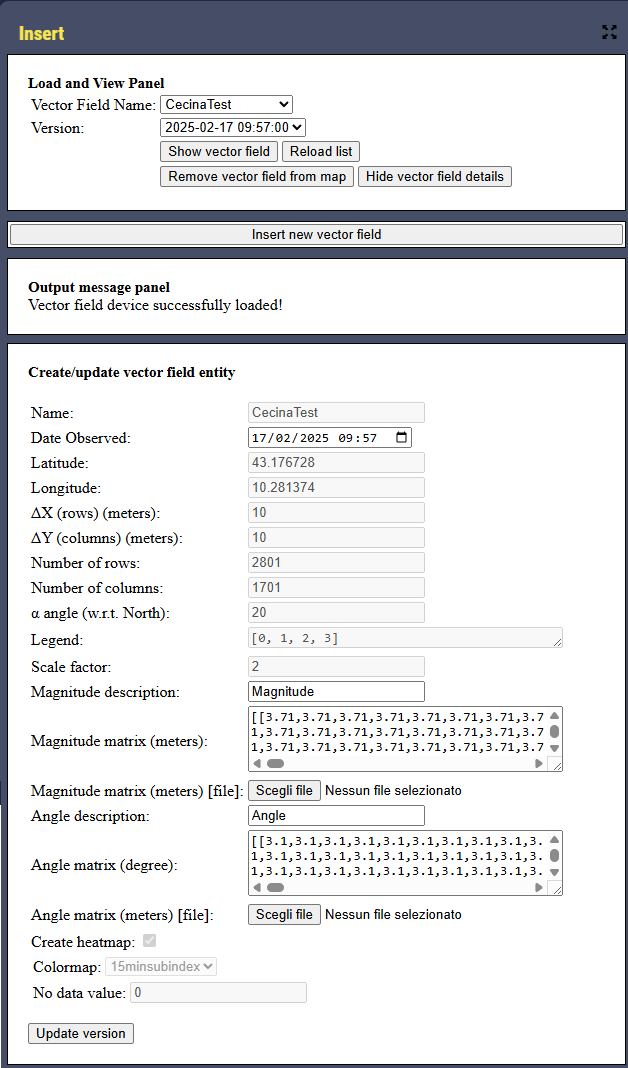
From the panel that can be visualized after clicking on View vector field details is it possible to insert a new version of the same vector field. As can be seen, most of the values are blocked from changes and the only modifiable values are the Date Observed, Magnitude and Angle. This is because it is supposed that a new version of the vector filed would work on the same area and grid, while presenting novel measurements.
After updating the values, the used click on Update version button and the new data are ingested by the system.
Note that Magnitude and Angle can be loaded by inserting text data in the text-area forms or by loading files in specific format (see more details in the Insert new vector field Section below). Data provided in the text-area has precedence, i.e., if both text data and file are provided, the file is ignored. Dimensions of data provided must match those reported in the Number of rows and Number of columns fields.
Note also that, in the case of Angle, the value loaded and displayed are sum of the and must be provided.
Insert new vector field
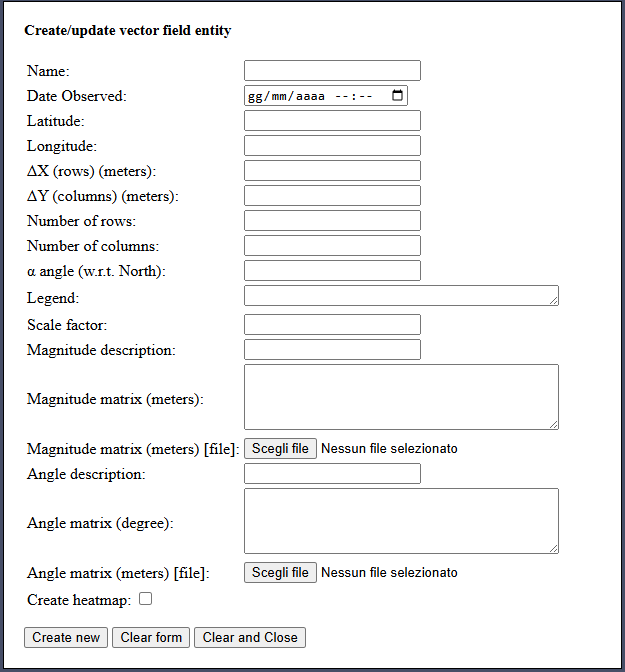
When clicking on Insert new vector field button, an empty form appears.
Note that by clicking on the button, a possibly loaded and displayed vector field is removed from the map.
In the insert form the following values must be specified:
- Name: the name of the vector filed the user wants to insert
- Date Observed: date time related to the measurement to be inserted. It can be selected on a date-picker popup that can be opened by clicking on the small calendar icon
- Latitude: latitude of the base-point of the grid on which the vector field is defined
- Longitude: longitude of the base-point of the grid on which the vector field is defined
- (rows) (meters): distance in meters of the grid points along the X dimension
- (rows) (meters): distance in meters of the grid points along the Y dimension
- Number of rows: number of rows of the grid over which the vector field is defined
- Number of columns: number of columns of the grid over which the vector field is defined
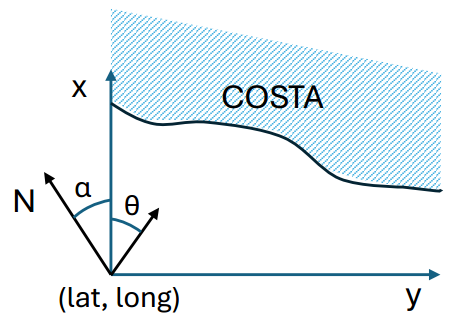
- angle: angle (in degree) w.r.t. the North direction (see Figure 3). It is used to orient the X and Y axis of the grid of the vector field. It can accept both positive and negative values
- Legend: info to be shown in the vector field legend. It is provided as an array of values (e.g., [0, 1, 2, 3]) indicating which vector magnitude must be shown in the vector field legend.
- Scale Factor: initial scale factor to be applied to the vector magnitudes for display purposes only.
- Magnitude description: description of the vector field magnitude (e.g., wave strength, wind speed, etc.)
- Magnitude matrix (meters): magnitude of the vectors reported as a Python matrix with dimension equal to Number of rows x Number of columns. Each row is an array, and the matrix is an array of the row arrays. For example, a 3x7 matrix is represented as [[0, 0.5, 0.8, 1.0, 1.1, 1.2, 1.3],[1.4, 1.5, 1.6, 1.7, 1.8, 1.9, 2.0],[2.1, 2.2, 2.3, 2.4, 2.5, 2.6, 3.0]]
Magnitude matrix (meters) [file]: a file to load magnitude data. The file must have a series of rows as the Number of rows. Each row must contain Number of columns values separated by whitespace characters or non-breaking spaces. This can be convenient when a huge number of grid points are considered. Note that: in the case both the text data and the file are provided, the text data are taken by default. To avoid problems, it is advised to specify only one of the fields.
- Angle description: as Magnitude description, but for the angle for each of the vectors considered. As for the magnitude, the values must be specified as a Python matrix with dimension equal to Number of rows x Number of columns.
- Angle matrix (meters) [file]: a file to load angle data. The file must have a series of rows as the Number of rows. Each row must contain Number of columns values separated by whitespace characters or non-breaking spaces. This can be convenient when a huge number of grid points are considered. Note that: in the case both the text data and the file are provided, the text data are taken by default. To avoid problems, it is advised to specify only one of the fields.
- Create heatmap: if checked, a heatmap is created relative to the magnitude data of the specified vector field. When checked, two additional parameters are requested.
- Colormap: it is used to specify the color map to be used to color the heatmap
- No data value: it can be used to specify a magnitude value to be excluded when computing the heatmap, for example to indicate that in a specific point no measurement is available. This is useful to design heatmaps that do not have perfect rectangular shapes.
When all data has been specified, the user can click the Create new button and start the uploading process. According to the data dimension this process can require different times. To help the user, messages about the status of the uploading process are shown in the Output message panel.
Differently, clicking on the Clear form button, the inserted data are deleted altogether. Clicking on the Clear and close button, data is deleted, and the panel is closed.
- AMMIRARE: make the beach system more resilient to climate change risks through the implementation of natural based solutions: https://www.snap4city.org/1002
Coordinator: Sant'Anna School of Advanced Studies
Partners: Tuscany Region, Liguria Region, Autonomous Region of Sardinia, Corsican Agency of Environment, University of Florence, UNIVERSITY OF PISA, National Research Council, ITALIAN NATIONAL INSTITUTE FOR ENVIRONMENTAL PROTECTION AND RESEARCH, Zoological Station Anton Dorhn, Port-Cros national Park, French Office for Biodiversity, GIS Posidonie, Mixted Syndicate for Floods, Development and Management of Maralpin Water, LaMMA Consortium - Environmental Monitoring and Modelling Laboratory for Sustainable development
![]()